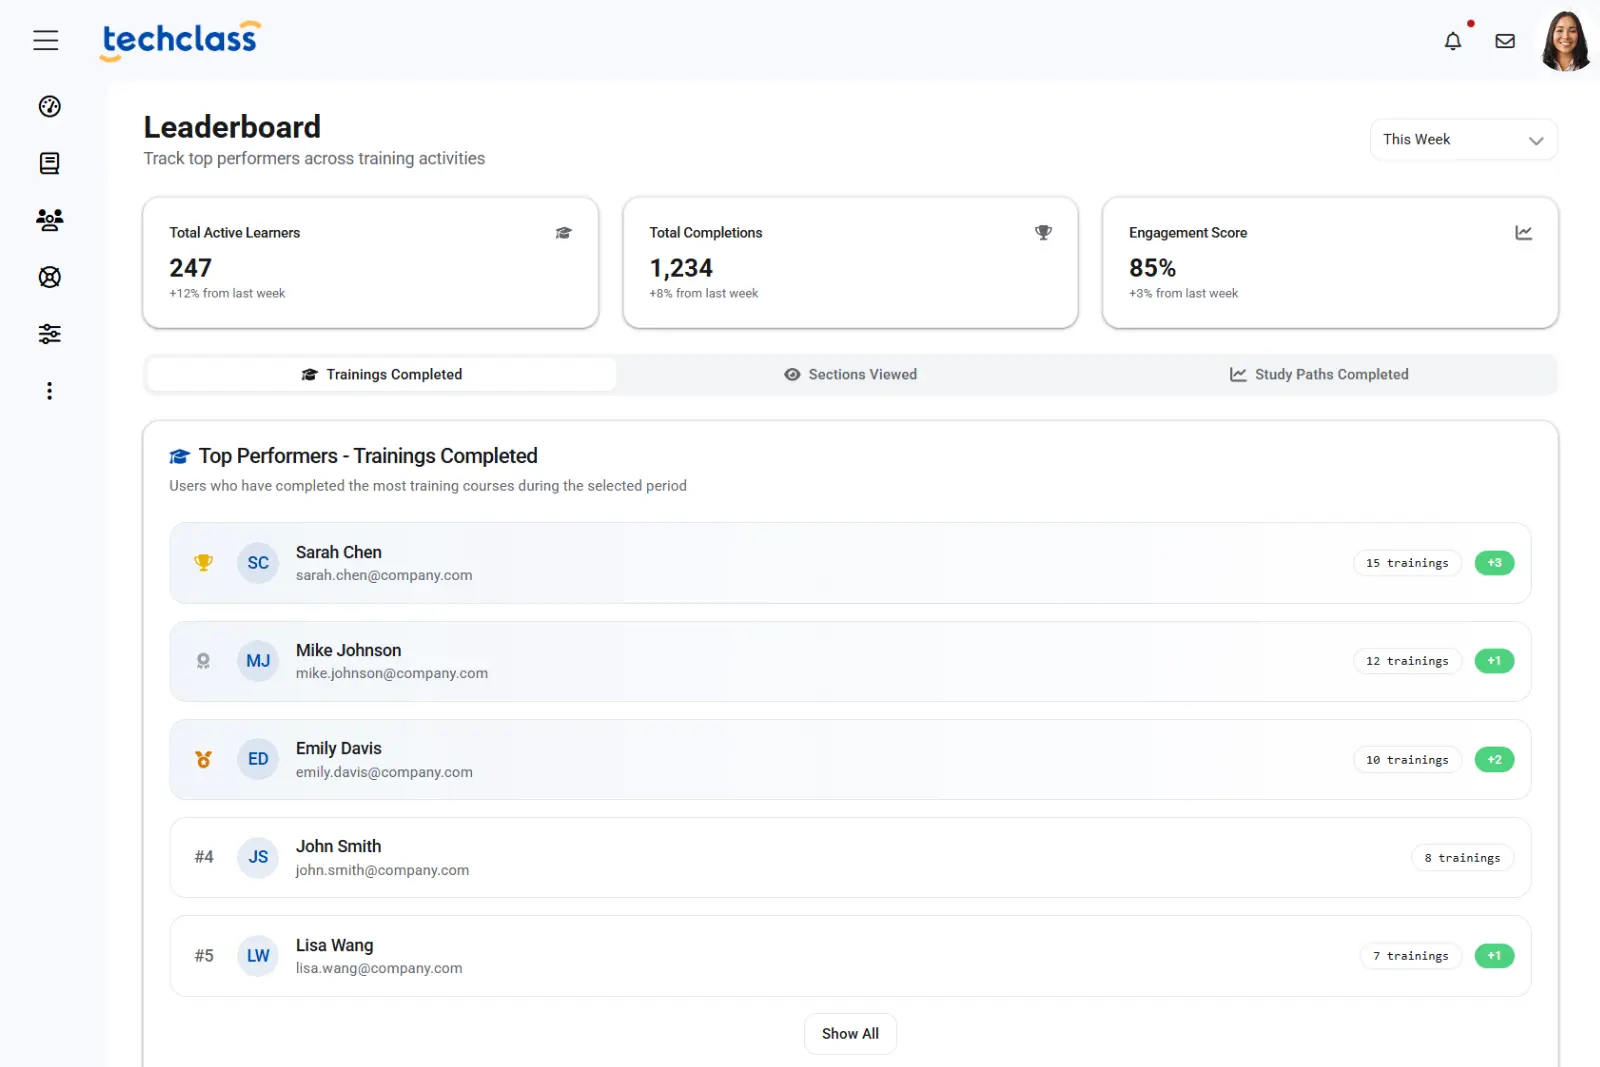
Platform Features

Actionable Insights and Reporting

Track progress, measure engagement, and unlock insights that drive smarter training decisions, all from one intuitive dashboards.
MacBook mockup

Learning Analytics That Scale With You

100%

real-time dashboards for live decision-making

10+

report types available for admins and instructors

50%

faster intervention in low-engagement cases

What Makes TechClass Reporting Powerful

Our platform goes beyond surface-level stats with intelligent tracking, real-time dashboards, and flexible reporting, so you can see what matters and act fast.
Dashboard mockup
Features

Learner Progress Tracking

Monitor individual and group progress with real-time tracking.

Completion Status

Track progress, assessment scores, and completion rates.

Engagement Metrics

Analyze time spent on lessons and interaction levels.
Features

Detailed User Activity Logs

Keep a comprehensive record of user activities with detailed logs. Administrators can track login times, interactions, and engagement levels to ensure compliance and performance monitoring.
Dashboard mockup
Features

Custom Report Generation

Create tailored reports that provide actionable insights.

On-Demand Reports

Generate reports based on training performance, user engagement, and completion rates.

Export Options

Download reports in multiple formats (PDF, CSV, Excel) for further analysis.
Dashboard mockup
Features

Smart Dashboards

TechClass LMS features intelligent dashboards that provide a snapshot of key learning metrics. These dashboards offer real-time data visualization, making it easier for administrators and instructors to make data-driven decisions.
Dashboard mockup
Dashboard mockup
Features

Leaderboard

Encourage friendly competition among learners with Leaderboards that showcase top performers based on progress, points, and achievements.

Real-Time Rankings

Display rankings based on XP, completed trainings, or quiz scores.

Customizable Criteria

Adjust leaderboard rules to align with learning goals.
Features

Data Visualization

Turn complex data into clear, visual insights for smarter decision-making.
Use interactive charts and graphs to explore key metrics
Quickly identify trends and performance patterns
Customize views with filters for targeted analysis
Dashboard mockup
Dashboard mockup
Features

Learner Sentiment & Engagement Insights

Gain a deeper understanding of learner experience through feedback tools that capture opinions, preferences, and reactions.

Training Feedback

Gather insights from learners on overall training effectiveness.

Chapter Ratings

Enable learners to rate individual chapters for quality and clarity.

Section Reactions

Allow quick emoji-based reactions for engagement measurement.

Explore More Platform Features

Engaging Learning Experience

Gamified, interactive, and personalized learning journeys
Mockup

Your Brand, Your Way

Fully branded platform with your logo, colors, and multi-language
Mockup

Secure, Compliant, and Supported

GDPR-ready, secure platform with dedicated support

Frequently Asked Questions

Find answers to common questions about TechClass’s analytics, reporting tools, and dashboards.
What types of reports can I generate in TechClass?
You can create on-demand and scheduled reports on learner progress, completion rates, engagement levels, assessment results, and platform usage. Reports are fully customizable by date, team, department, or course.
Can I export the data for use in other tools?
Yes. Reports can be exported in multiple formats including PDF, Excel, and CSV, making it easy to integrate insights into presentations, audits, or internal reporting systems.
Does TechClass provide real-time data?
Absolutely. All dashboards and reports are backed by real-time data, so you can track progress, spot issues, and act instantly without delays.
Who has access to reporting features?
TechClass provides role-based access: admins, team leaders, and instructors can access reporting relevant to their scope, ensuring both flexibility and data privacy.
Can I automate recurring reports?
Yes. You can schedule automated reports to be sent weekly, monthly, or at a custom frequency. This keeps stakeholders updated without extra admin work.
What’s included in the activity logs?
Activity logs track logins, page views, training interactions, and communication history. They’re perfect for audits, compliance tracking, and understanding platform engagement.
Can I measure engagement beyond just completion?
Yes. TechClass includes detailed engagement metrics, such as time spent on content, quiz participation, and platform interaction, giving you a deeper view of learner behavior.
Is there a way to collect user feedback within the platform?
Yes. Our Platform Feedback feature allows learners, instructors, and admins to submit suggestions and experience insights, which can be analyzed for improvement trends.

Start Your 14-day Free Trial

Uncover what’s working and what’s not. Start your free trial to explore real-time dashboards, smart reports, and the insights that drive better training outcomes.